Fig. 4.
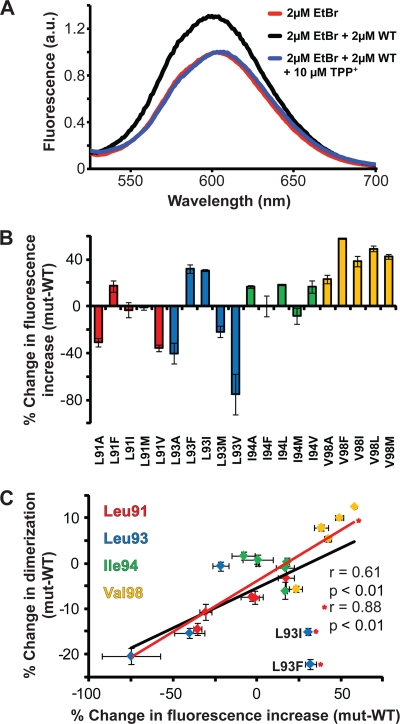
Ethidium binding propensities of Hsmr TM4 mutants. (A) Ethidium fluorescence emission spectra of 2 μM ethidium bromide alone (red) or with 2 μM WT Hsmr or with 10 μM TPP+ in 0.08% DDM buffer upon excitation at 485 nm. Fluorescence is shown in arbitrary units (a.u.). (B) Percent fluorescence increase at 600 nm of each mutant shown as a histogram relative to the WT. (C) Dimerization versus ethidium binding data (Fig. 2 and Fig. 4B, respectively) relative to the WT. Correlation analysis performed using Prism reveals a significant correlation (P < 0.01) and a Pearson coefficient of r = 0.61. Upon removal of the L93I and L93F outliers denoted by asterisks, the correlation increases (r = 0.88; P < 0.001). Mutants are color coded as follows: strains with mutations at Leu91 are shown in red, strains with mutations at Leu93 are shown in blue, strains with mutations at Ile94 are shown in green, and strains with mutations at Val98 are shown in yellow. Error bars represent the propagated SEM of at least three experiments.

