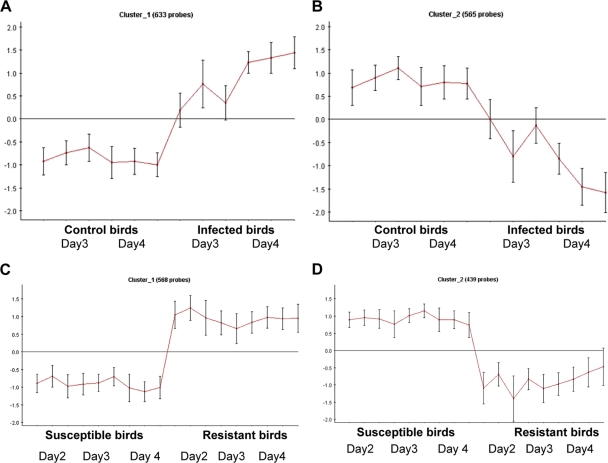
Fig. 1.
Gene expression clusters generated using the Expander program (http://acgt.cs.tau.ac.il/expander/expander.html). Shown are the expression profiles of genes upregulated during the response to virus (A) and those downregulated (B). When genes expressed in the two different lines were examined, similar profiles were noted: gene expression was inherently higher in the resistant line (C), and genes were more highly expressed in the susceptible line (D).

