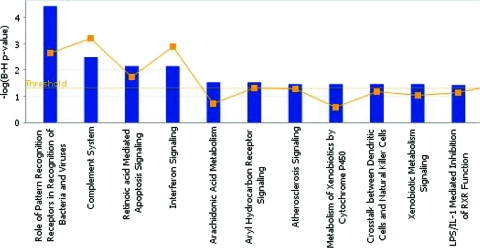
Fig. 3.
Ingenuity pathway analysis of the host response to MDV infection. Shown are the most highly represented canonical pathways as revealed after IPA of genes differentially expressed during the host response to MDV (in the spleen). The line represents the ratio of the number of genes represented within each pathway to the total number of genes in the pathway.

