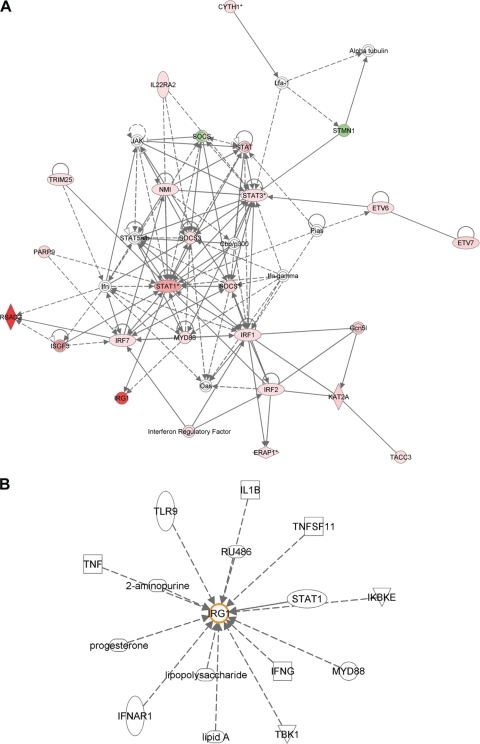
Fig. 4.
Network analysis using the IPA program. (A) Interaction network representing genes involved in the inflammatory response, showing genes upregulated in response to MDV infection (red) and genes downregulated (green). IRG1 is seen to be highly upregulated in this analysis. (B) Genes currently known to interact with IRG1.

