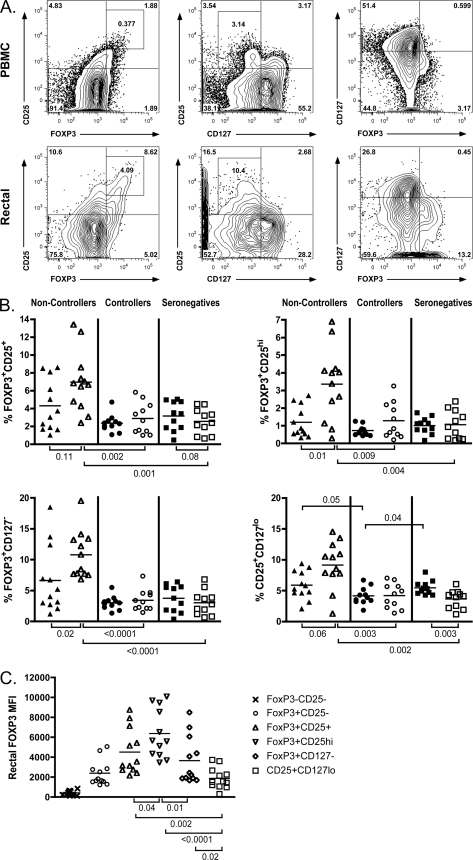
Fig. 1.
Treg frequency is increased in the rectal mucosae of noncontrollers regardless of the gating strategy used to identify Treg. (A) Representative flow cytometry plots depicting four different approaches for identifying CD4+ Treg in human PBMC (top panels) and rectal cells (bottom panels) in the FOXP3+ CD25+ (left), FOXP3+ CD25hi (left, inset), CD25+ CD127lo (middle), and FOXP3+ CD127− (right) groups. Numbers within the gates represent the frequencies of the gated CD4+ subpopulations. (B) Treg frequencies in PBMC (solid symbols) and RMNC (open symbols) of noncontrollers (triangles), controllers (circles), and seronegative subjects (squares) were analyzed using the gating strategies described above. (C) FOXP3 expression in the rectal mucosae was determined by MFI and compared between each of the four Treg gating approaches. FOXP3− CD25− non-Treg and the FOXP3+ CD25− subsets were included in the analysis as reference groups. FOXP3 MFI was highest within the CD4+ FOXP3+ CD25hi and CD4+ FOXP3+ CD25+ gates. This graph contains data from the noncontroller patients; a similar pattern of expression was seen in controllers and seronegative subjects. Horizontal lines within the groups correspond to the mean. The numbers above and below the brackets are P values. P values of ≤0.05 were considered significant; P values between 1 and 0.05 were considered trends.

