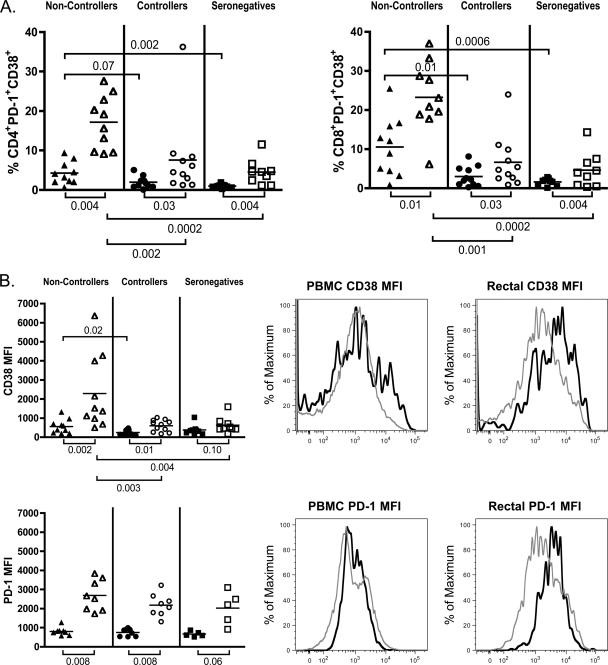
Fig. 3.
Markers of T cell activation are elevated in total CD8+, CD4+, and Treg populations in the mucosae of noncontrollers. (A and B) Treg frequencies in PBMC (solid symbols) and RMNC (open symbols) of noncontrollers (triangles), controllers (circles), and seronegative subjects (squares) were stained as described in Materials and Methods, and data were acquired on an LSRII flow cytometer. Horizontal lines within the groups correspond to the mean. The numbers above and below the brackets are P values. P values of ≤0.05 were considered significant; P values between 1 and 0.05 were considered trends. (A) Coexpression of CD38 and PD-1 was used to assess T cell activation in total CD4+ (left) and CD8+ (right) T cells in the blood and rectal mucosae of the three patient groups. (B) MFI of CD38 (top panel) and PD-1 (bottom panel) in Treg populations of noncontrollers, controllers, and seronegative subjects (left). Shown are representative histograms from a noncontroller comparing MFI in CD4+ FOXP3− CD25− non-Treg (gray lines) to CD4+ FOXP3+ CD25+ Treg (black lines) for CD38 (top panels) and PD-1 (bottom panels) in the peripheral blood and rectal mucosae (right).

