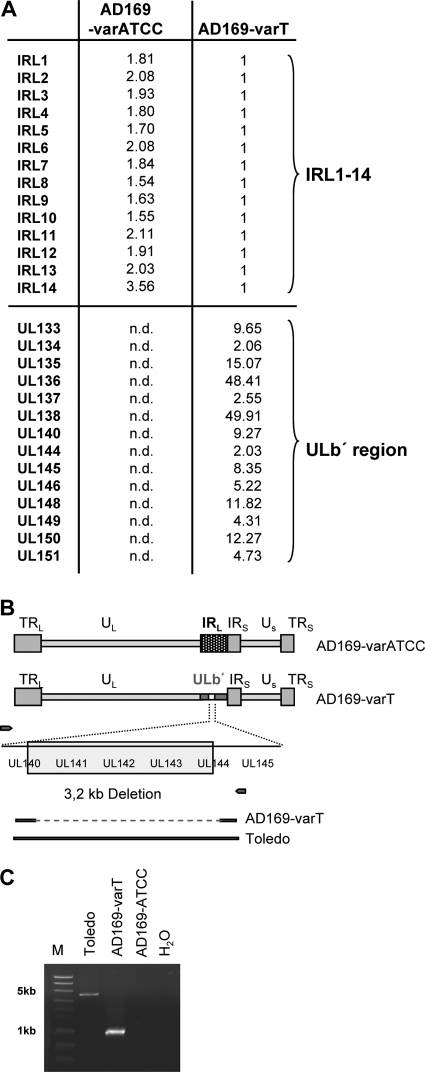
Fig. 1.
AD169-varT contains ULb′ region genes. (A) RNAs from cells infected with either AD169-varATCC or AD169-varT for 72 h were compared by microarray analysis. Only genes found to be differentially expressed are listed. Expression of IRL11-4 gene family members in AD169-varT-infected cells was set to a relative intensity of 1. Expression levels of IRL1-14 genes from AD169-varATCC-infected cells is shown as the fold increase. Transcripts of the listed ULb′ genes were not detected (n.d.) over background in AD169-varATCC-infected cells. Expression levels of these genes in AD169-varT-infected cells is shown as the fold increase over background measurements. Thus, scores for genes either equally expressed or lacking in both variants were approximately 1, and for matters of clarity those were omitted from the illustration. As detailed in panels B and C, genes for UL141 to -143 genes were lacking from the ULb′ region of AD169varT and are therefore not listed. (B) Schematics of the genomic architec-tures of AD169-varATCC and AD169-varT as delineated from the microarray analysis. The blow-up shows a subfragment of the ULb′ region present in AD169-varUC, containing a characteristic deletion encompassing 3′ sequences of UL140, the entire UL141, UL142, and UL143 genes, as well as 5′ sequences of UL144 (5). Small arrows to the left and right of the deleted region reflect the position of a primer pair that was used to amplify this region from AD169-varT. Bold and dotted lines shown below are the relative expected sizes of the amplification products when using this primer pair on strains Toledo and AD169-varT, respectively. (C) PCR products of the amplification using the depicted primer pair.

