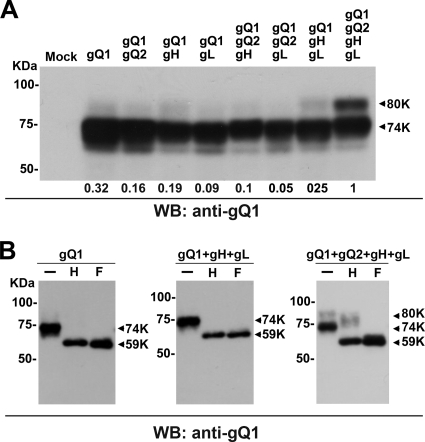
Fig. 1.
Maturation of gQ1-80K in the presence of gQ2, gH, and gL. (A) 293T cells were transfected with a gQ1 expression plasmid and different combinations of expression plasmids for gQ2, gH, and gL. The combinations are indicated at the top. The cells were harvested and lysed on day 2 posttransfection. The extracts were analyzed by Western blotting (WB) using an anti-gQ1 MAb (AgQ1-119). The positions of gQ1-80K and gQ-74K are indicated by arrows. The density of the gQ1-80K band from each sample was analyzed by ImageJ software (NIH) relative to the value when all four components of the complex were expressed together, and the results are given at the bottom. (B) The cell lysates from panel A were digested with Endo H (H) and PNGase F (F) and analyzed by Western blotting using MAb AgQ1-119. −, no digestion.

