
Fig. 1.
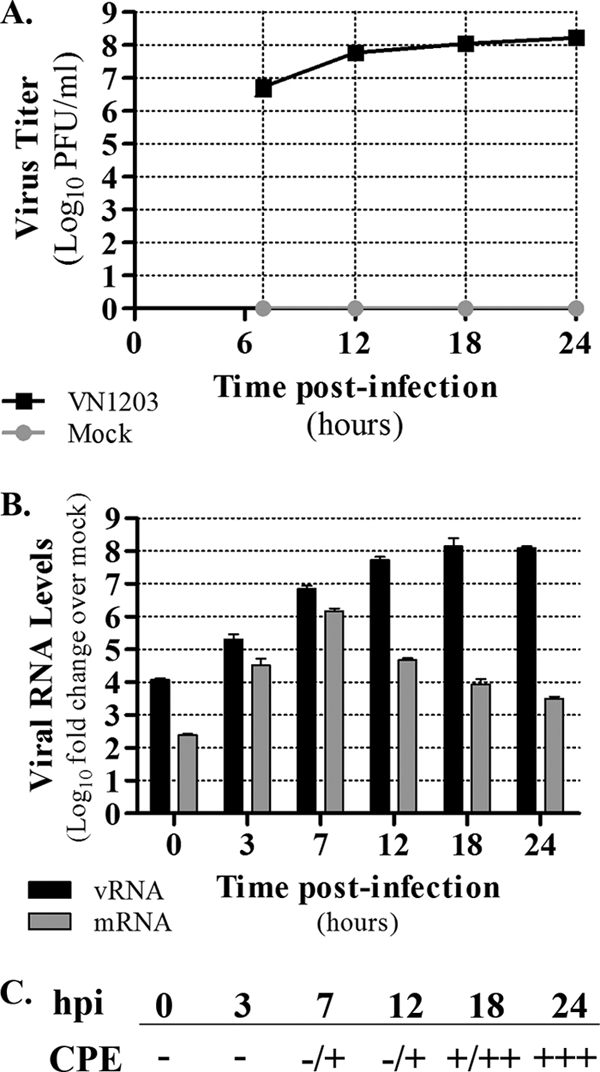
VN1203 infection of Calu-3 cells. (A) Calu-3 cells were infected with VN1203 (MOI of 1), and supernatants were harvested for the quantification of infectious virus production by plaque assay in MDCK cells. Log10 viral titers are shown for 7, 12, 18, and 24 h postinfection (hpi), with variation indicated by ± standard deviations for six biological replicates. (B) The level of segment 5 (nucleoprotein; NP) genomic viral RNA and mRNA was determined by qPCR for each time point (0, 3, 7, 12, 18, and 24 hpi). Note that the 0-h time point was designated the end of the incubation period with virus inocula. Values represent the average log10 fold changes relative to levels for time-matched mock-infected control samples, and variation is indicated by ± standard deviations from three biological replicates. (C) CPE was microscopically assessed at each time point, and the level is indicated using a +/− scale as described in Materials and Methods.