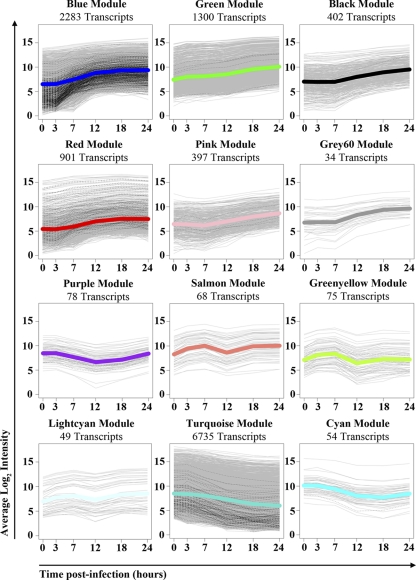
Fig. A3.
Twelve modules were identified as host response subnetworks that are significantly connected using the topological overlap measure. For each plot, gray lines mark averaged log2 intensities for individual module transcripts, with the subset of transcripts upregulated at 7 hpi represented by black dashed lines. Thick lines represent the average module log2 intensity and are colored according to module color designation. The total number of transcripts mapping to each module is indicated above each plot.

