
Fig. 5.
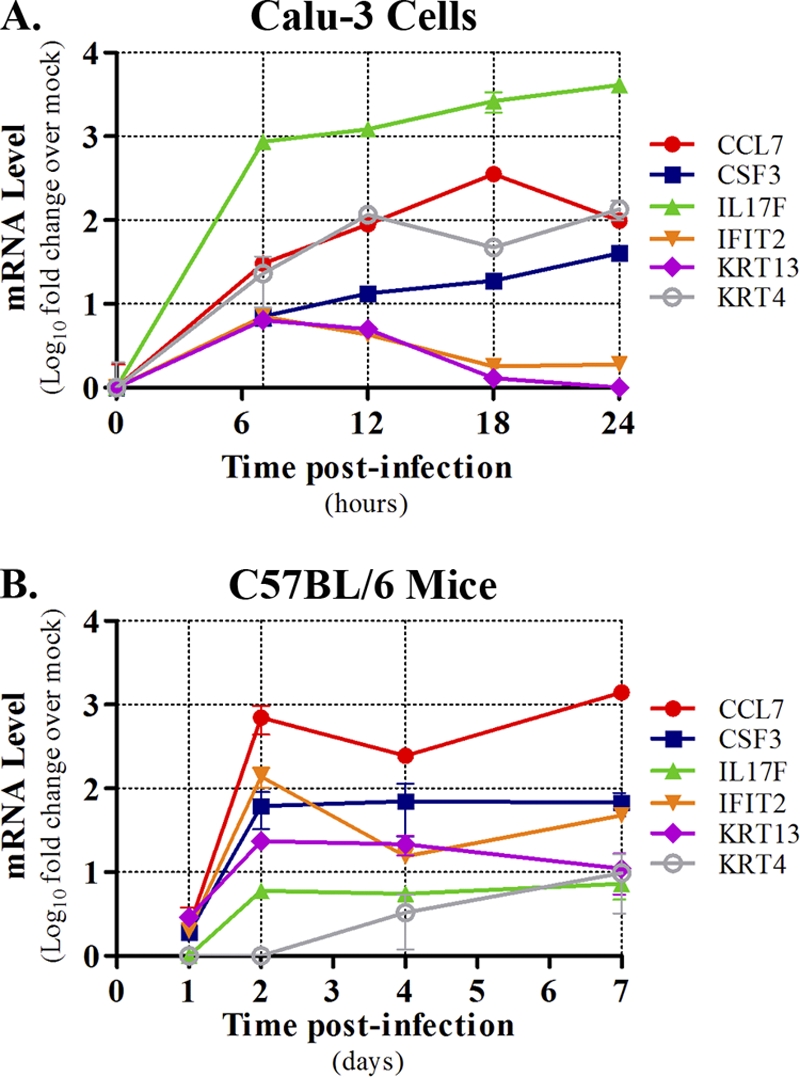
Validation of specific blue module transcripts in VN1203-infected Calu-3 cells and C57BL/6 mouse lungs. Total RNA isolated from VN1203-infected Calu-3 cultures (A) or lungs of VN1203-infected mice (B) was subjected to qPCR using gene-specific primers. Transcript fold changes were quantified based on time-matched mock-infected controls and are expressed as log10 mean values ± standard deviations from at least two biological replicates. The model system is indicated above each panel, and a key is shown to the right of each graph.