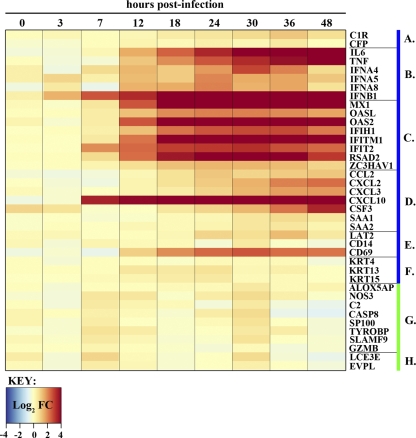
Fig. 8.
Host transcript expression profile in NL602-infected Calu-3 cells. A heat map shows NL602 cellular gene expression over time for the same transcripts as those shown in Fig. 4. Fold changes for individual transcripts are depicted on a log2 scale, with a blue-to-dark-red gradient indicating down- and upregulation, respectively. The gene groups depicted in lanes A to H are the same as those described in the Fig. 4 legend.

