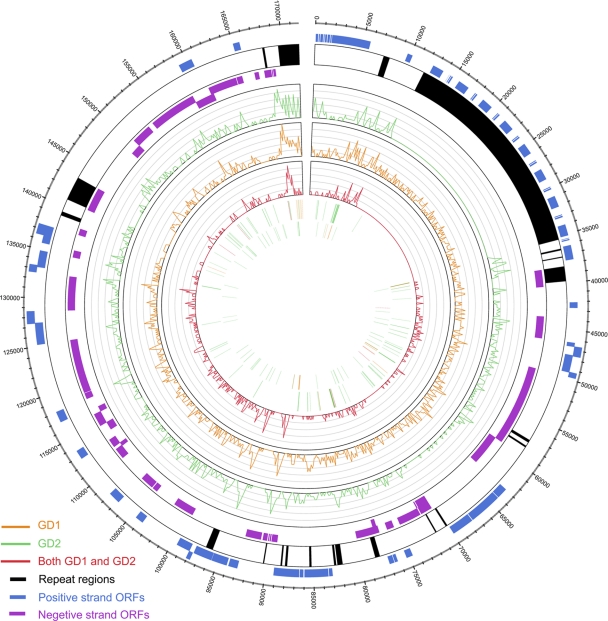
Fig. 4.
Genome-wide comparison of the GD1 and GD2 genomes. The figure was created using Circos (25). The outer circle shows the positive-strand open reading frames (ORFs) (blue), repeat regions (black), and negative-strand ORFs (violet) in the reference EBV-WT genome. The curves in the inner circles show the distributions of SNVs in GD2 (green) and GD1 (orange) and those that are common to GD1 and GD2 (red), using EBV-WT as the reference. The bars in the first and second inner circles show the deletions and insertions, respectively, corresponding to GD2 (green) and GD1 (orange) and both GD1 and GD2 (red).

