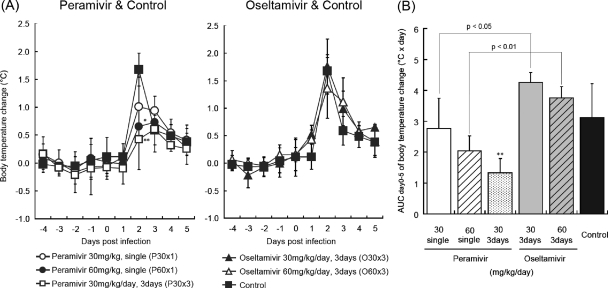
Fig. 3.
Body temperature changes in ferrets. On day 0, the nasal cavities of ferrets were inoculated with B/Kadoma/1/2005. The ferrets' body temperatures were recorded every 15 min by data loggers implanted into their peritoneal cavities. (A) The body temperatures were calculated from the average temperatures during nighttime (10 p.m. to 8 a.m.), and the body temperature after virus inoculation was compared with that before virus inoculation. A significant reduction of average temperature is observed in groups P60×1 and P30×3 on day 2 p.i. (*, P < 0.05; ** P < 0.01) in comparison with the control group (left graph). No significant difference is observed in a comparison between groups treated with oseltamivir and a control group (right graph). (B) AUCs of body temperature change were calculated by use of the trapezoidal rule on the basis of the means of the body temperature change on days 0 to 5. Group P30×3 shows a statistically significant reduction in body temperature change AUC compared with the control group (**, P < 0.01). Significant differences are observed between groups P30×1 and O30×3 and between groups P60×1 and O60×3.

