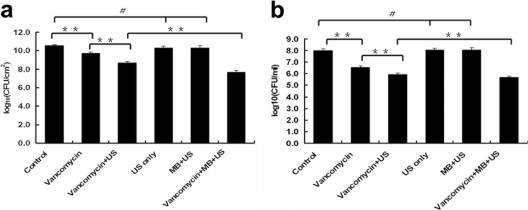
Fig. 5.
Comparison of viable bacteria recovered from biofilms and planktonic bacteria after treatments. Data are expressed as means plus standard deviations (n = 9). (a) Viable counts recovered from biofilms. (b) Viable counts from planktonic cells. The error bars represent 95% confidence intervals. Asterisks denote statistically significant differences; **, P < 0.01. # denotes no significant difference between groups, P > 0.05.

