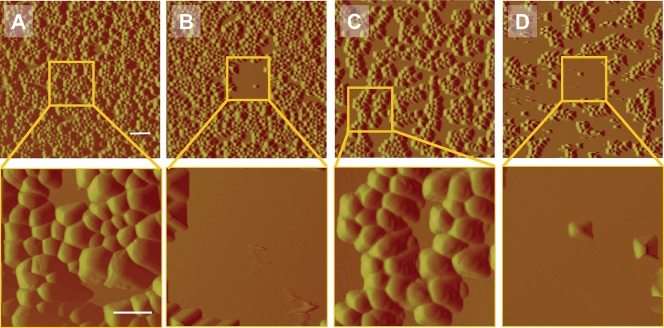
Fig. 4.
AFM deflection images of staphylococcal strains during exposure to 10 mM potassium phosphate buffer and QAC solutions in buffer after a single scan (35 by 35 μm) and after multiple scans in the center region (8 by 8 μm; insets) at a rate of 1 Hz during 300 min. (A and B) S. aureus 7232 (slime producer) exposed to buffer (A) and a 2× MBC QAC solution (B). (C and D) S. epidermidis ATCC 12228 (non-slime producer) exposed to buffer (C) and a 2× MBC QAC solution (D). The bars denote 2.5 μm for the upper pictures and 1 μm for the lower pictures.

