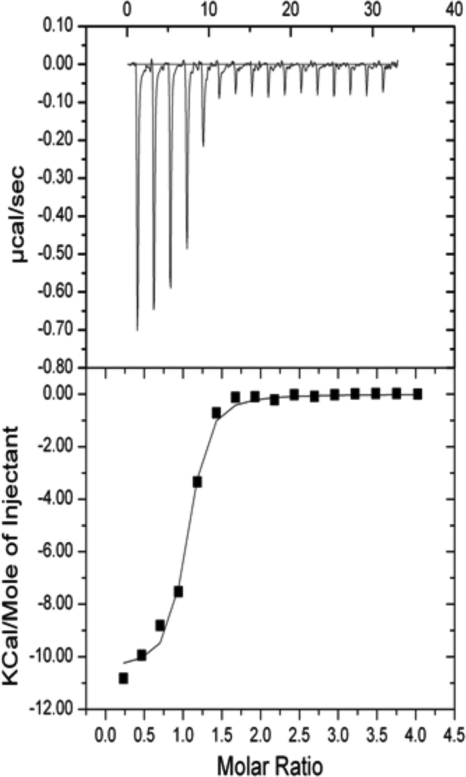
Fig. 6.
Calorimetric titrations of bovicin HC5 with DOPC vesicles containing 2 mol% lipid II. Vesicles were dissolved in 10 mM Tris and 150 mM NaCl (pH 7.5). The graph on the top shows the heat peaks after injections of 5 μl vesicles (20 mM final phospholipid concentration) into the sample cell containing 20 μM bovicin HC5 in the same buffer. The bottom graph displays the integrated heat per injection, normalized to the injected amount of moles of lipid II and displayed against the molar ratio of lipid II versus bovicin HC5.

