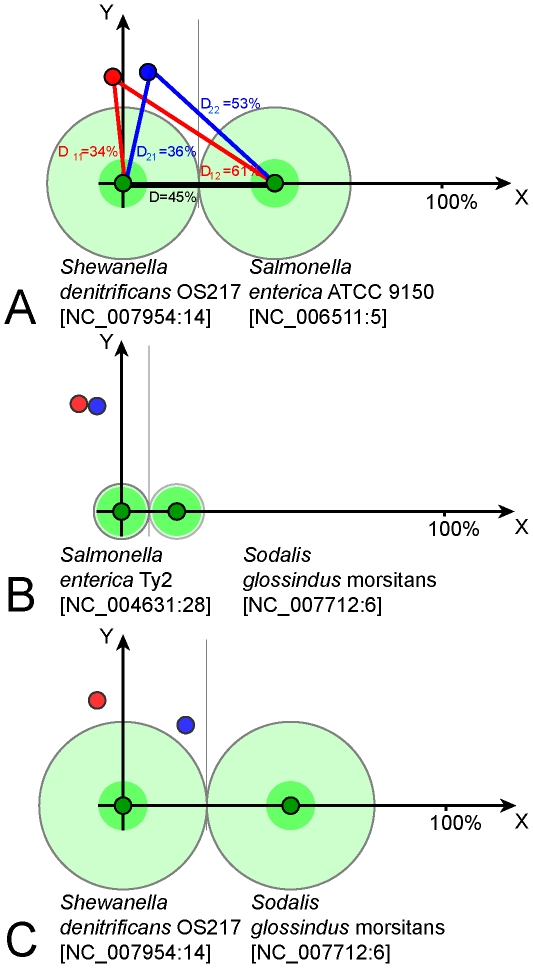
Figure 6. Donor recipient relationships determined for GIs from Salmonella, Shewanella and Sodalis.
X axis shows the distance between host chromosomes depicted by dark green circles. Shaded green areas around circles outline intergenomic variability of local OU patterns. Shaded light green areas around genome circles and an intermediate grey vertical line depict the half-distance between chromosomal OU patterns. GIs of the organisms on the left and right are shown as red and blue circles, respectively. Y values for the GIs are based on the distance values calculated between OU patterns of these GIs and their host chromosomes as explained in ‘Materials and methods’. GI IDs are as in GEI-DB. A) Comparison of GIs NC_007954:14 and NC_006511:5 from S. denitrificans OS217 (3177400..3199999) and S. enterica ATCC 9150 (858550..886299). Distance values used in the calculations are shown. B) Comparison of GIs NC_004631:28 and NC_007712:6 from S. enterica Ty2 (2847050.. 2866799) and S. glossindus morsitans (1186850.. 1242349). C) Comparison of GIs NC_007954:14 and NC_007712:6 from S. denitrificans OS217 and S. glossindus morsitans.

