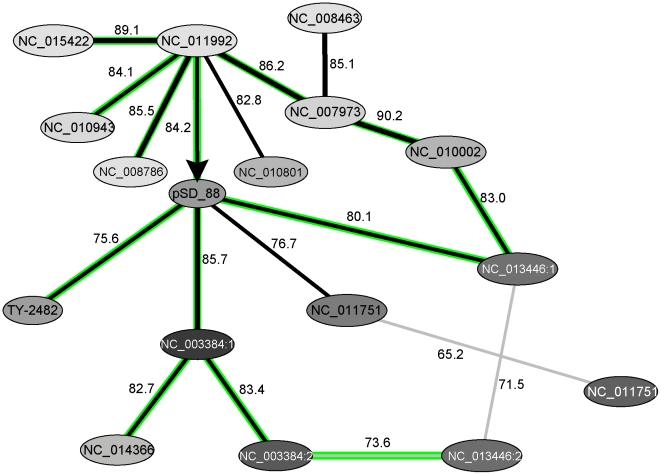
Figure 10. Stratigraphic analysis and OU pattern similarity relations between GIs showing similarity to the mercury resistance GI of the plasmid pSD_88.
Each node corresponds to one GI named as in Table 2. Values for OU pattern similarity shared between nodes are shown above the edges. Gradient colours depict divergences of GIs patterns from the complete genome patterns of their host organisms as in Fig. 5. Putative direction of GI transfer NC_011992 to pSD_88 is depicted by an arrow (see also Fig. 11).

