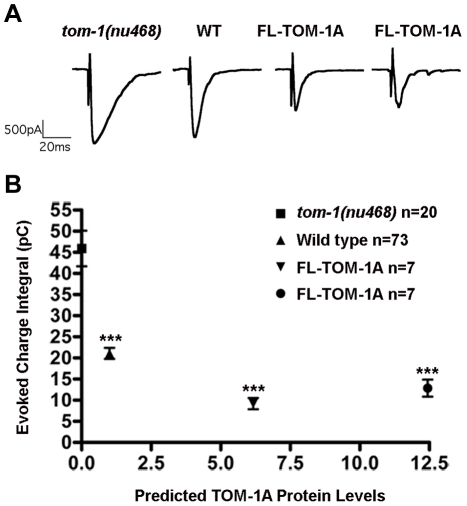
Figure 1. Inverse-relationship between predicted full-length TOM-1A expression levels and synaptic function.
A. Representative evoked post-synaptic responses from the NMJ of tom-1(nu468), wild type and two TOM-1A integrated lines, SY1229 and SY1242, expressed in the tom-1(nu468) mutant background respectively. B. Average charge integral for evoked responses of tom-1(nu468) (n = 20), wild type (n = 73) and tom-1(nu468) over-expressing TOM-1A integrated lines SY1242 (∼6 fold mRNA levels) (n = 7) and SY1229 (∼12 fold mRNA levels) (n = 7) plotted against predicted TOM-1A expression levels based on quantitative real-time RT-PCR (qRT-PCR) normalized to C. elegans actin (act-1) transcript levels. Data plotted as mean ± SEM (significance values relative to tom-1(nu468), *** p≤0.0001, Mann Whitney T-test). Representative evoked NMJ traces are displayed above each strain.

