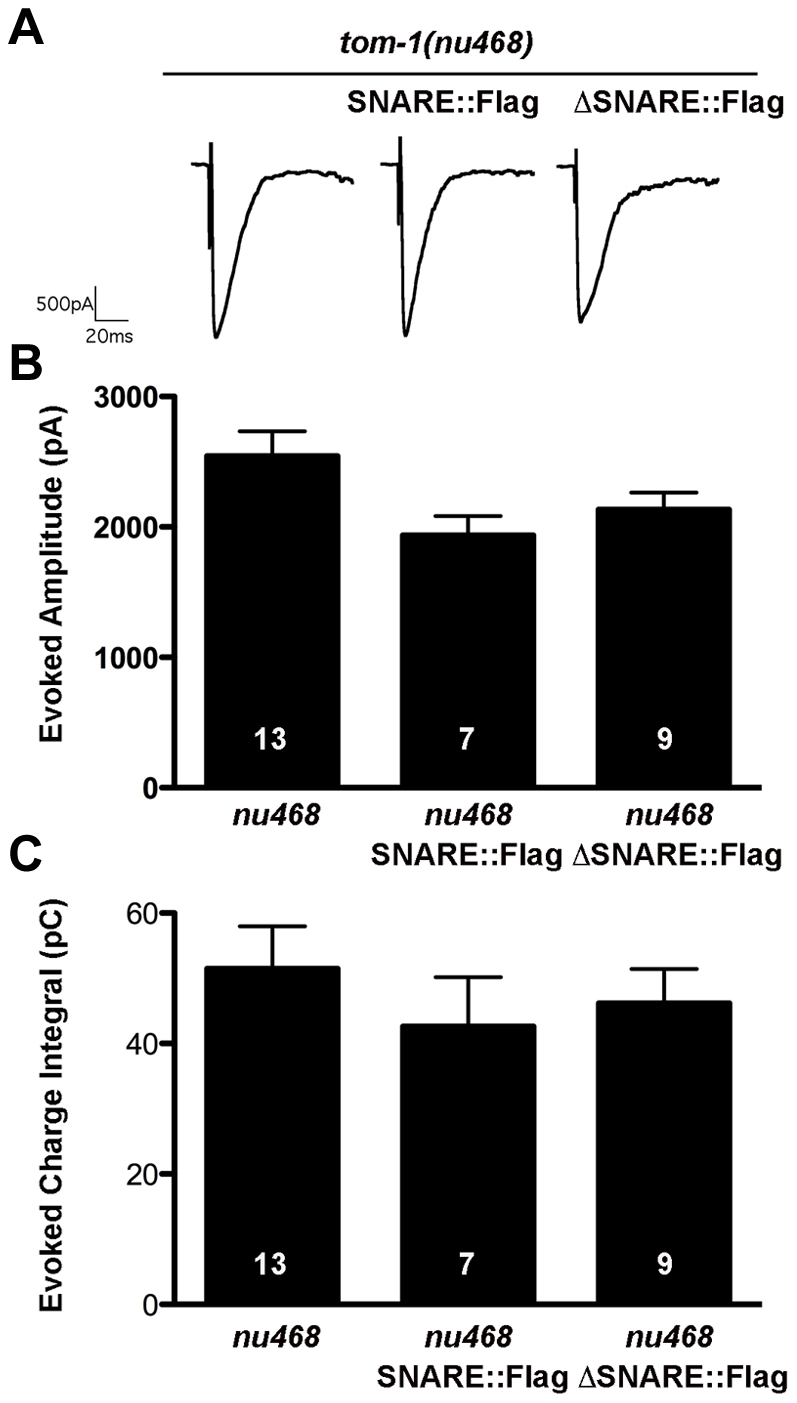
Figure 4. Flag-tagged TOM-1A SNARE and ΔSNARE transgenics phenocopy untagged lines.

A. Representative evoked response traces for SNARE::FLAG (SY1232) and ΔSNARE::FLAG (SY1233) expressing lines. B. Plots of average evoked amplitude and (C) evoked charge integral. All data are expressed as mean ± SEM, the sample size (n) is indicated as a number in each bar. Mann Whitney T-tests showed values were not significantly different.
