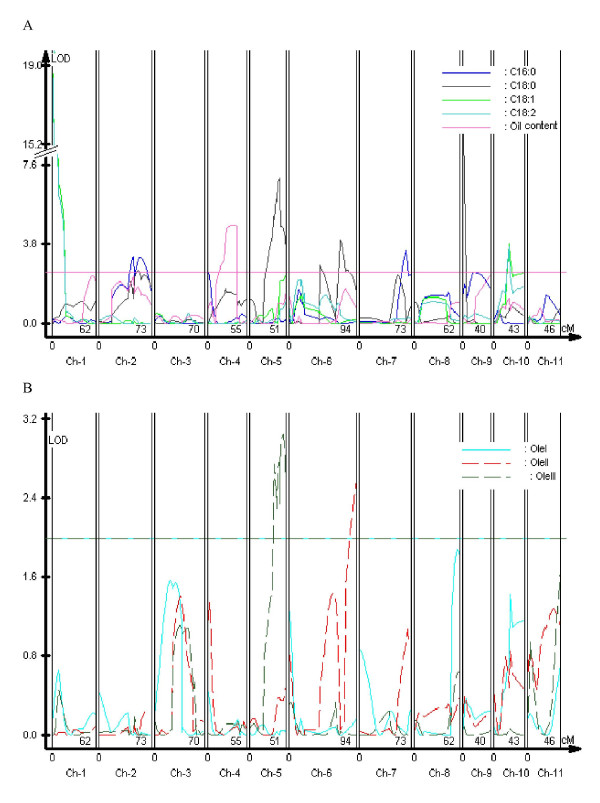
Figure 1.
Whole genome scan for QTL for oil traits and Oleosin gene expression in jatropha. A QTL scans of oil traits on linkage maps. Horizontal line indicates 5% LOD significance thresholds (2.5) based on permutation. B QTL scans of OleI, OleII and OleIII expressions on linkage maps. Horizontal line indicates LOD significance threshold (2.0).

