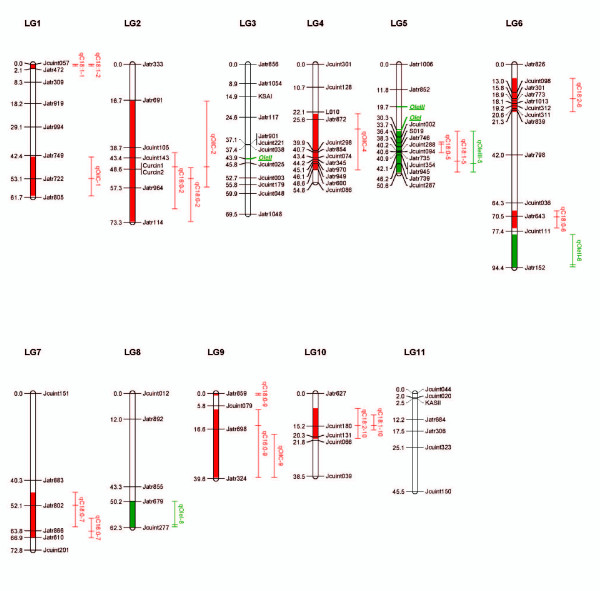
Figure 2.
Summary of QTL (eQTL) locations detected on the genome of jatropha. QTLs (eQTLs) represented by bars are shown on the left of the linkage groups, close to their corresponding markers. The lengths of the bars are proportional to the confidence intervals of the corresponding QTLs (eQTLs) in which the inner line indicates position of maximum LOD score.

