
Figure 3.
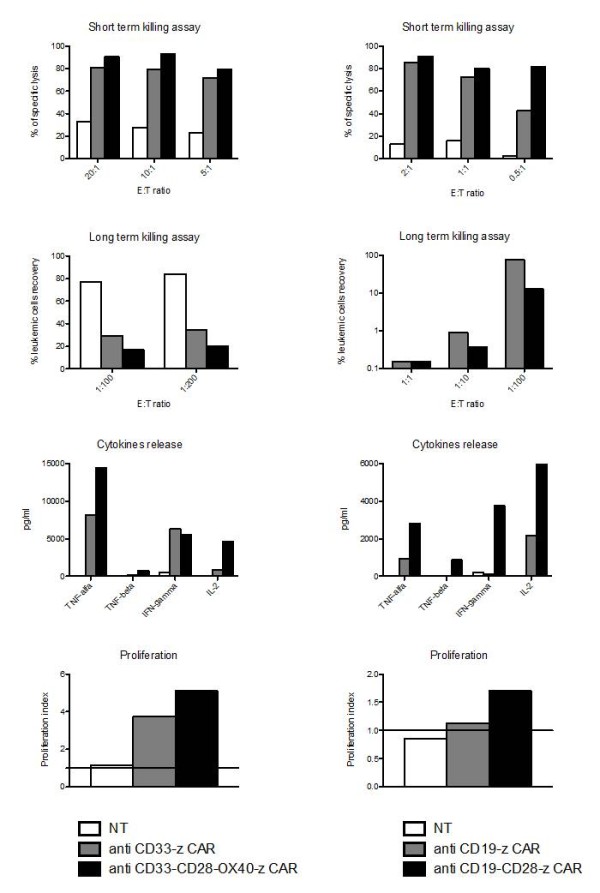
CARs activity towards myeloid (CD33+) and lymphoid (CD19+) acute leukaemias. The figures show different tests adopted to measure the efficacy of transduced T cells. The panels on the left side describe the effect on AML cells, whilst the right panels on ALL cells. The test shown are, starting from the top: 1) short term cytotoxicity, by classic Chromium release assay; 2) long-term cytotoxicity, measured as recovery of leukaemia cells after 1-week of co-incubation with effectors cells; 3) cytokine release, by Elisa tests; 4) proliferation index, measured as ration versus the basal number by thymidine incorporation assay. All the tests are described in details in reference no. 19.