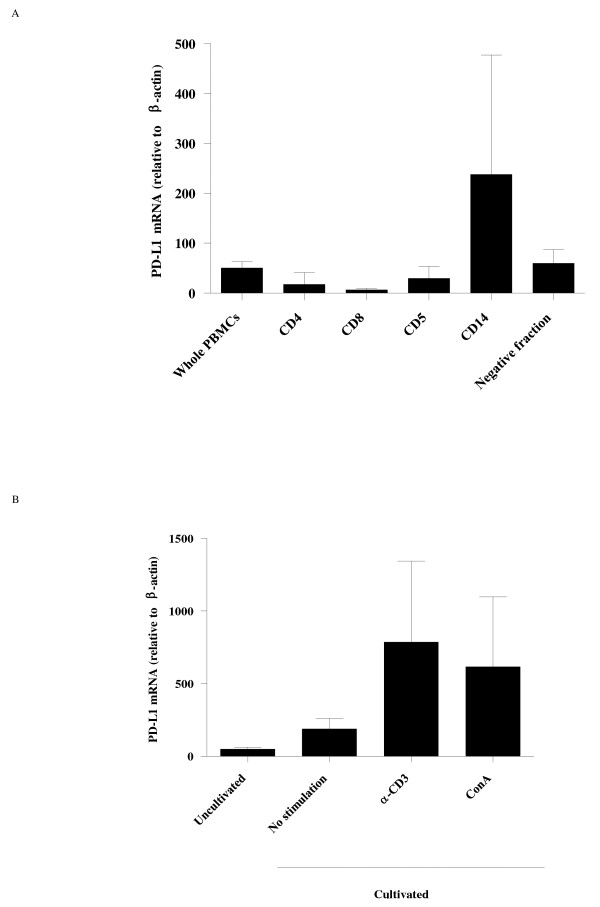
Figure 2.
Analysis of bovine PD-L1 mRNA expression by real-time PCR. A: PD-L1 mRNA expressions were determined in total PBMC from three healthy Holstein cattle, subpopulations of CD4+, CD8+, CD5+, CD14+ cells and negative fraction for these subpopulations. B: PD-L1 mRNA expression in PBMC incubated with or without either anti-bovine CD3 antibody (αCD3) or ConA. The level of the PD-L1 mRNA expression was shown as the ratios obtained by dividing concentrations of the PCR products from PD-L1 mRNA by those from β-actin mRNA. Error bars represent the SD of the means among the three cows.

