Figure 3.
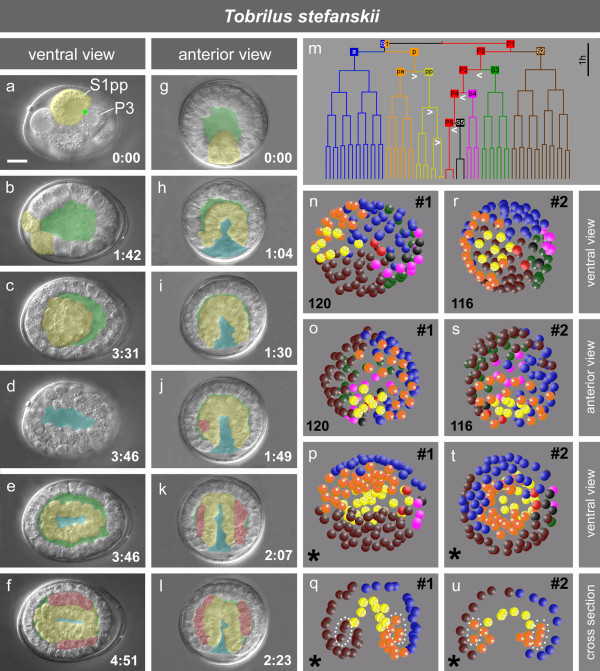
Embryogenesis of Tobrilus stefanskii. a-f; g-l, cleavage, blastocoel formation, gastrulation and tissue formation of two embryos. Yellow, alimentary tract precursor(s); green, blastocoel; blue, slit-like blastopore; red, body muscle cells, green dot, primary POC; time in hours and minutes; m, cell lineage with seven somatic lineage branches and the germline (P0-P5); white arrowheads, asymmetric divisions; n-q and r-u, 3-D reconstructions of two embryos with similar stages indicating different spatial arrangements of cells. Each sphere represents a nucleus, color code as shown in m; p, t, partial reconstruction (*), not all cells could be traced, total cell number > 200; q, u, same stages as p and t, respectively, optical cross section; dotted areas, cells contributing to mesoderm. Scale bar, 10 μm.

