Figure 3a.

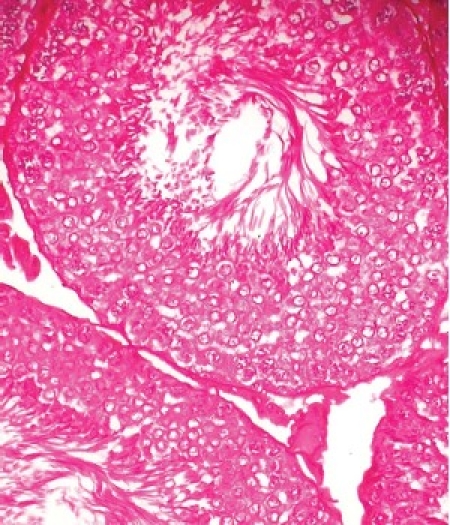
Photomicrograph of the testes of LM (×400) of normal control rats showing organized distribution of various types of cells in the seminiferous epithelium of the tubules and interstitium

Photomicrograph of the testes of LM (×400) of normal control rats showing organized distribution of various types of cells in the seminiferous epithelium of the tubules and interstitium