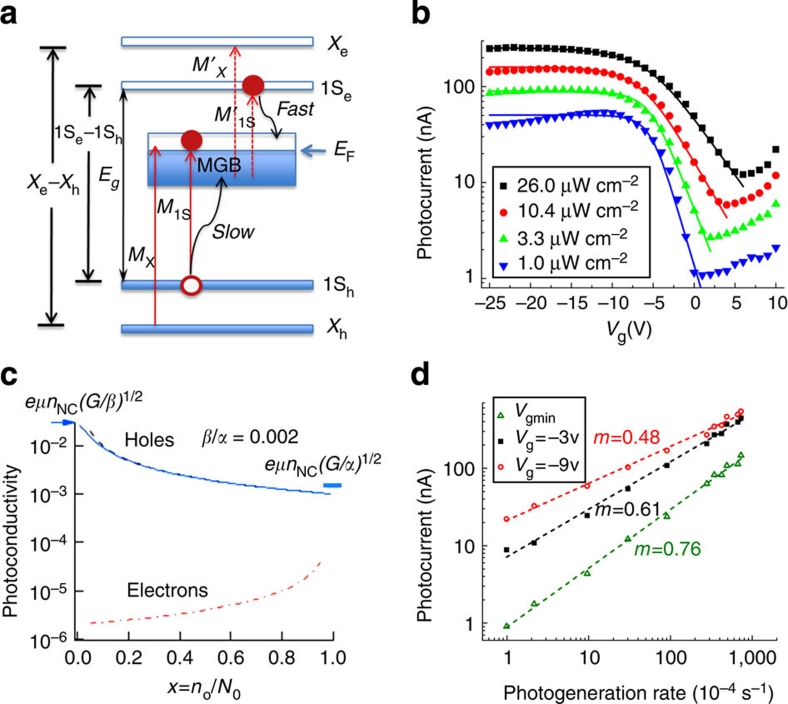
Figure 3. Effect of MGB occupancy on photoconduction.
(a) The energy level diagram illustrating optical transitions between the NC-quantized and MGB states (red arrows) as well as relaxation pathways (wavy black arrows) for photogenerated band-edge carriers. The blue arrow marks the position of the Fermi level (EF). (b) Photocurrent measured at different gate voltages (symbols) for light intensities from 1.04 to 26.1 μW cm−2 (indicated in the figure legend) using 2.25 eV illumination. Lines are calculations using equations (4) and (5). In the modelling, the excitation intensity was characterized by the dimensionless quantity g=G/(βN02). On the basis of the photocurrent measured at large negative Vg for 26.1 μW cm−2 (solid black squares), g was determined to be 1.3×10⁻³. For other traces, g was obtained by scaling this value according to light intensity used in the measurements. γ and V0 were adjustable parameters determined from the fits. The obtained values systematically varied from 0.016 to 0.007 (±0.001) for γ and from 2 to 6 V (±0.15 V) for V0 with increasing light intensity. (c) Calculated photoconductivity due to electrons (dashed-and-doted red line) and holes (dashed black line) using equation (3) and assuming that x is within the interval from 0.05 to 0.95. Solid blue line is the hole photoconductivity obtained using equation (4). The arrows mark the hole-only (left) and electron-only (right) photoconductivities in the limits of x=0 and x=1, respectively. (d) The dependence of Isd on photogeneration rate for different gate voltages (3.1 eV photon energy). As expected for a transition from bimolecular to linear recombination, the log–log slope of this dependence is ~0.5 for the large negative gate bias (MGB is completely empty) and approaches unity as the gate bias gets more positive (MGB becomes populated).

