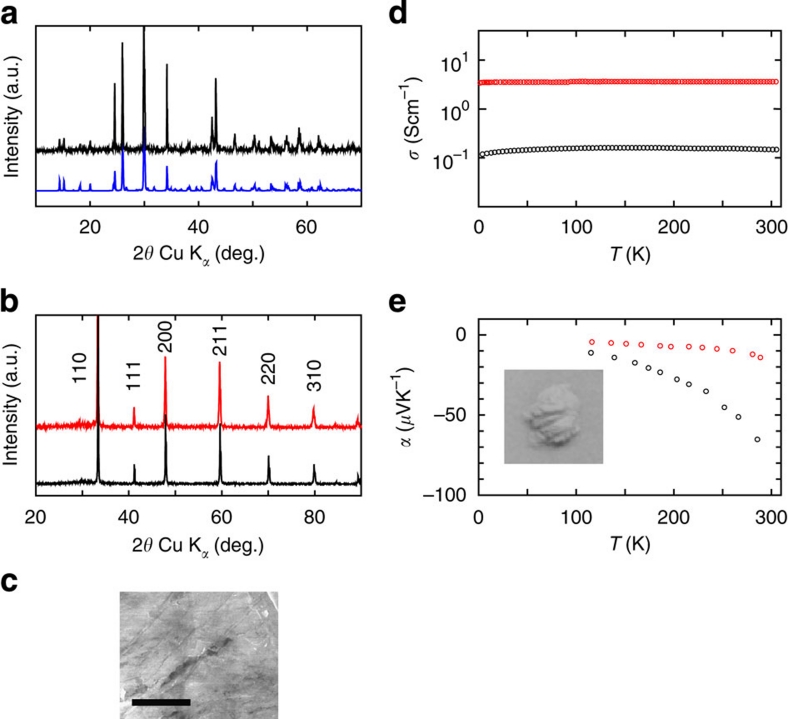
Figure 2. Powder X-ray diffraction (XRD) patterns and electrical properties.
(a) Measured powder XRD pattern of the SrGeO3 sample synthesized at AP (black symbols) along with its simulation pattern (blue symbols). (b) Measured powder XRD patterns of the undoped (black symbols) and La-doped SrGeO3 samples (red symbols) after the HP treatment. (c) SEM image of polished surface of HP-SrGeO3 pellet. Scale bar shows 3 μm. (d) Temperature dependence of the electrical conductivities and (e) Seebeck coefficients for the undoped (black symbols) and the La-doped HP-SrGeO3 (red symbols). Inset to e shows a photograph of the undoped HP-SrGeO3 powder.

