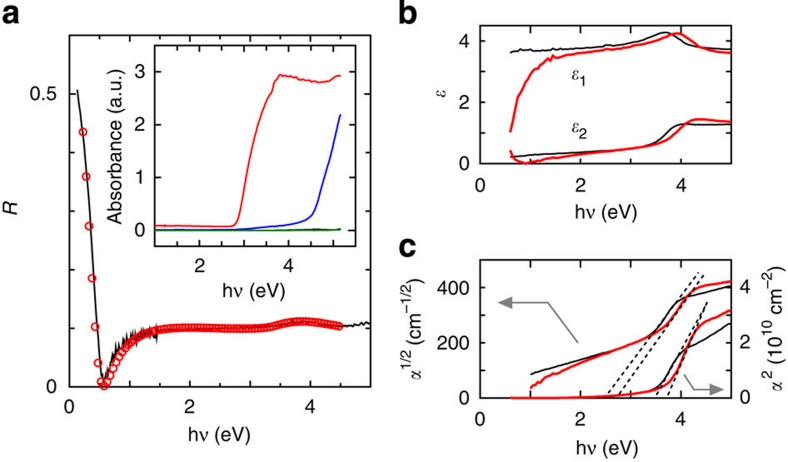
Figure 3. Bandgaps of HP-SrGeO3 and related germanium oxides.
(a) Reflectance spectra of La-doped HP-SrGeO3. The solid line shows the measured data and the red circles show the simulated result using the Drude–Tauc–Lorentz combined model. The inset shows the diffuse reflectance spectra of the powder samples of undoped AP-GeO2 (the green line), HP-GeO2 (blue), AP-SrGeO3 (completely overlapped with the data of AP-GeO2, the green line) and HP-SrGeO3 (red). (b) Dielectric functions and (c) absorption spectra for undoped (the black lines) and La-doped HP-SrGeO3 (the red lines) obtained by spectroscopic ellipsometry. The absorption spectra are plotted for the direct and indirect transition-type semiconductors.

