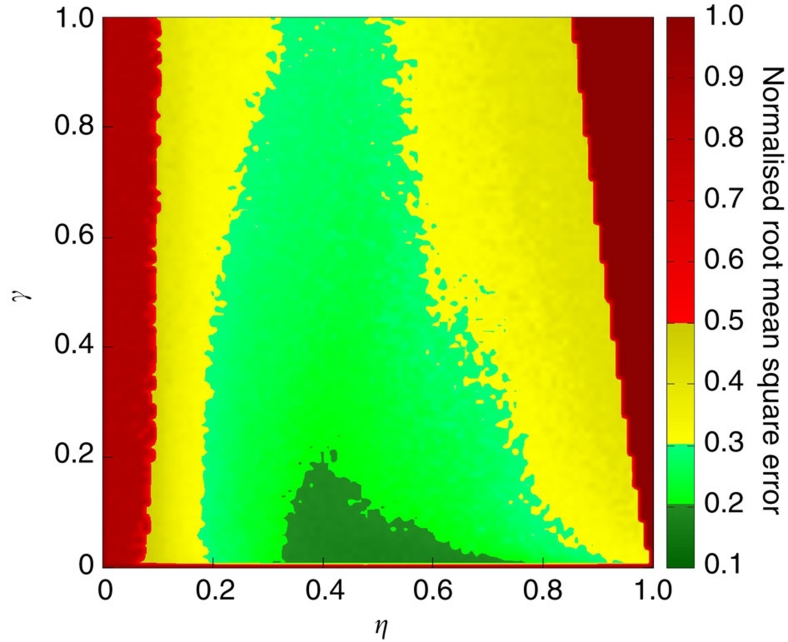
Figure 5. Simulation results for the NARMA task.
The two scanned parameters are γ (input scaling) and η (feedback strength). The exponent in equation (1) is set to p=1. Other characteristics of the reservoir are as in Figure 4 (τ=80, N=400, θ=0.2). The obtained performance for the NARMA-10 task, expressed as a normalized root mean square error, is encoded in colour.

