
Figure 1.
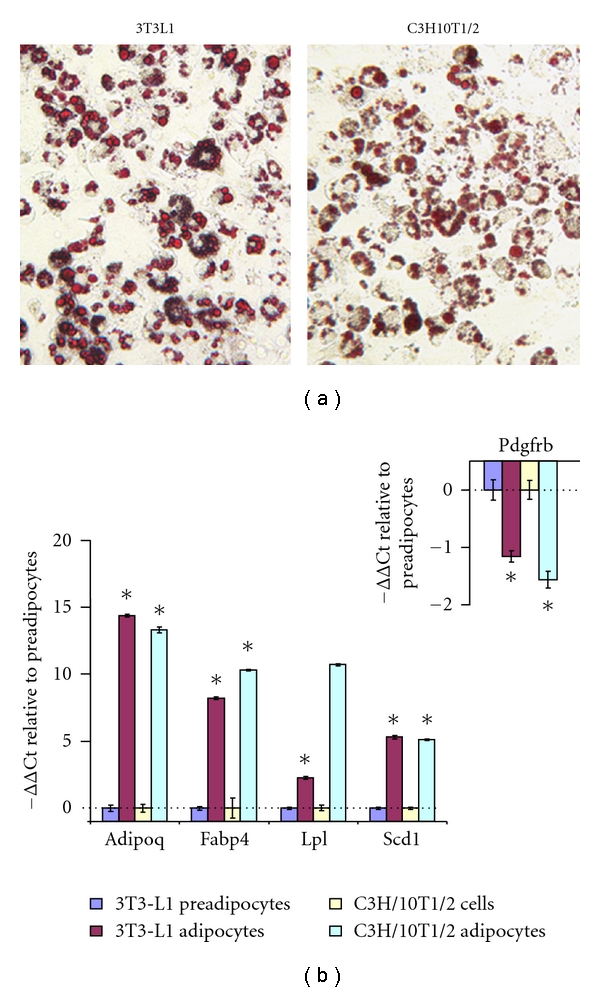
Phenotypic and molecular characterization of 3T3-L1 and C3H/10T1/2 adipocytes after differentiation. Differentiated 3T3-L1 and C3H/10T1/2 adipocytes were stained with Oil Red O ((a) Magnification = 200x). Alternatively, QRT-PCR was performed using RNA extracted from cells prior to and after differentiation (b). Relative mRNA levels of adipocyte markers Adipoq, Fabp4, Lpl, and Scd1, and preadipocyte/fibroblast marker Pdgfrb (inset in (b)) in differentiated cells were compared to those in preadipocytes. The QRT-PCR data were expressed as –ΔΔCt, equivalent to log2-transformed fold changes. All numerical data were expressed as mean ± S.E. *P < 0.05 compared to the respective preadipocytes.