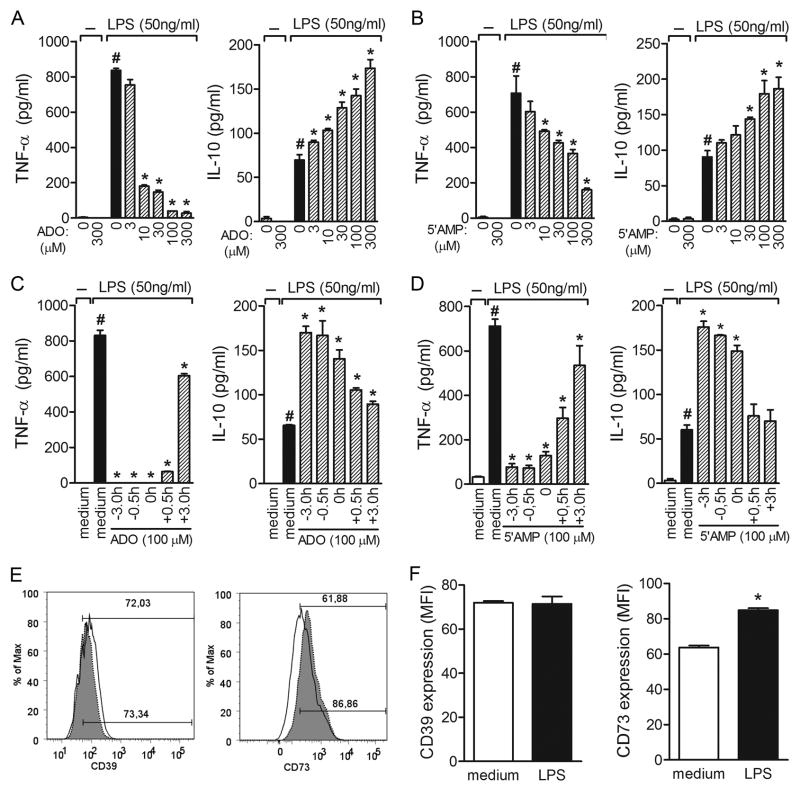
Figure 5. Effects of ADO and 5′AMP on TNF-α and IL-10 production by LPS-stimulated DCs.
BMDCs were incubated without (open bars) or with (shaded bars) 50 ng/ml LPS for 24 h after overnight pre-incubation with increasing concentrations of ADO (A) or 5′AMP (B) (μM). Cytokine production was measured in the culture supernatants by ELISA. Time-course inhibition of cytokine production by 100μM of ADO (C) or 5′AMP (D) in LPS-stimulated BMDCs. The results are expressed as the mean±SEM obtained from one of three independent experiments made in triplicate (N =3 per group). *, P <0.05 compared with LPS stimuli. Surface molecules were labeled with FITC or PE conjugated with anti-CD11c, anti-CD39, or anti-CD73; representative mean fluorescence intensity (MFI) of BMDC staining from medium or LPS cultures is shown in each box (E). The filled histograms represent cells labeled with the specific mAb; the empty histograms represent the same cell suspension labeled with isotypic control mAb. In (F), the bars display the relative MFI obtained from one of four independent experiments made in quadruplicate (N =4). *, P<0.05 compared with medium.

