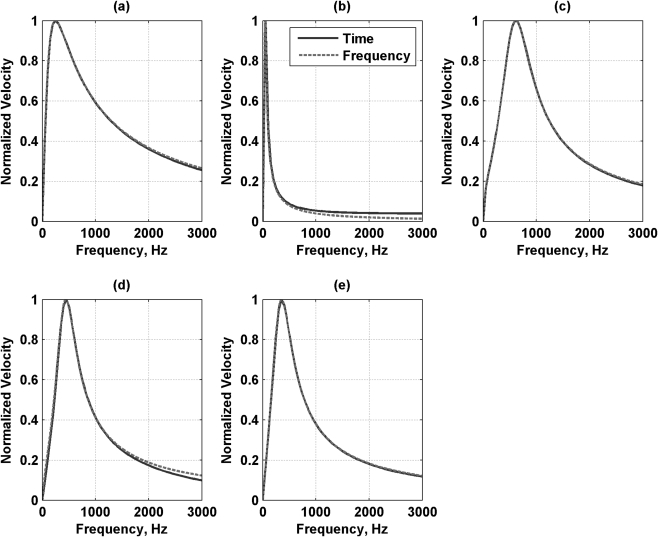
Figure 2.
(Color online) Comparison of velocity responses from generalized Aglyamov (time-domain) and Oestreicher (frequency-domain) models. (a) Kelvin–Voigt model, (b) Maxwell model, (c) generalized Maxwell model, (d) Zener model, (e) Kelvin–Voigt fractional derivative model. For all panels the solid curve is calculated from the time-domain response and the dashed line is calculated from the frequency-domain response.

