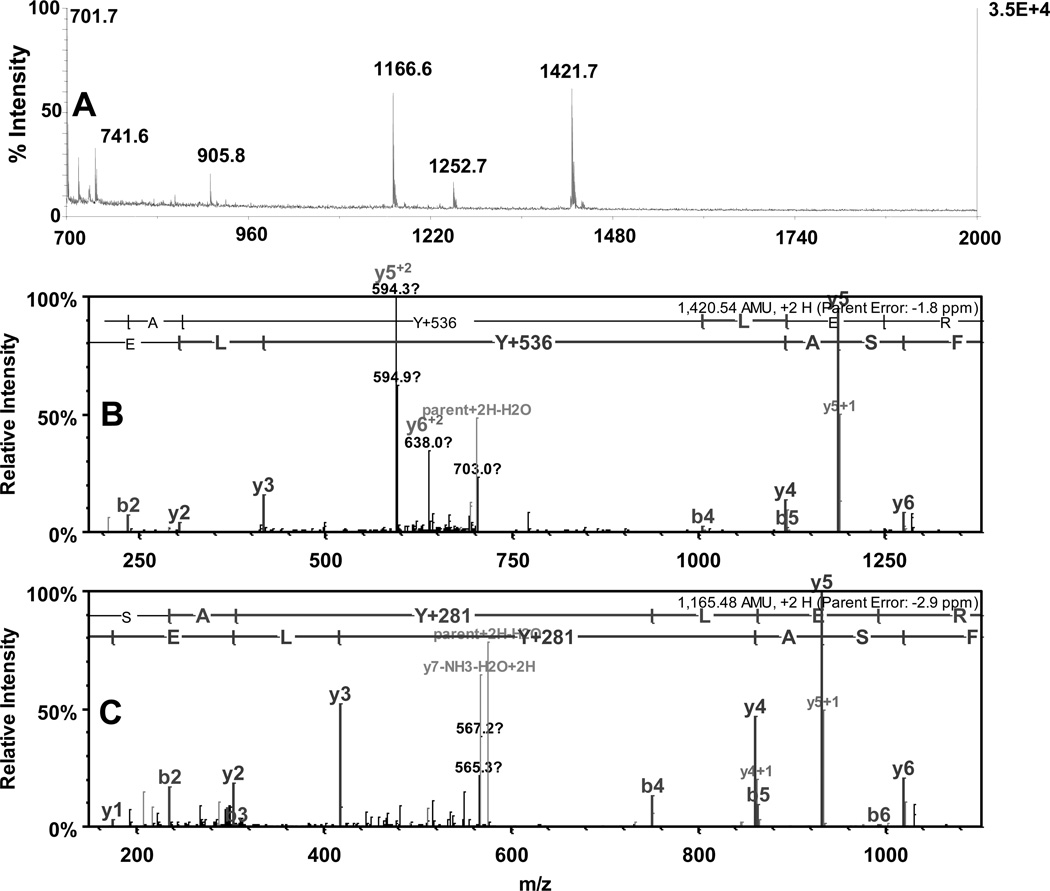
Figure 7.
Analysis of fluorescent boronate affinity HPLC fractions (13–18 min. in chromatogram 3, Fig.6A) by MALDI-TOF (A) and capLC-FT-ICR MS (B and C). B and C represent tandem MS spectra for APPD-tagged FSAY*LER ions with mass shifts of Y+536 (m/z 1421.5) and Y+281 (m/z 1166.6), respectively, present in panel A.

