
Figure 2.
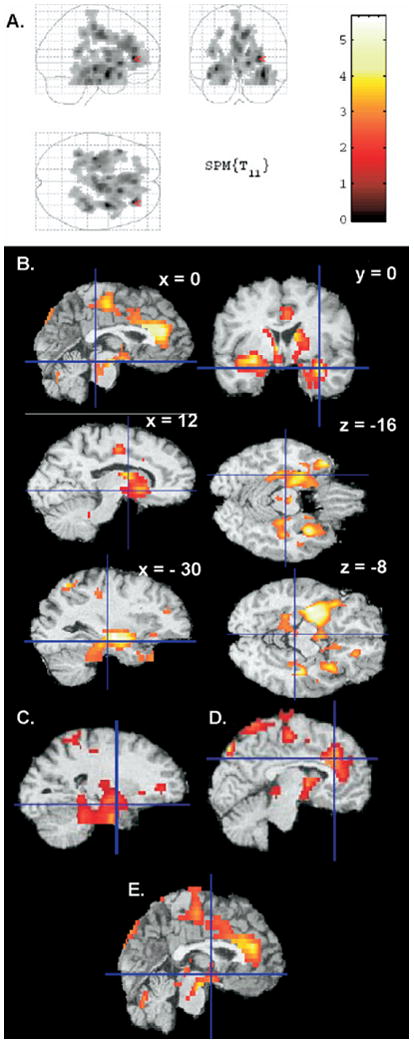
Areas with greater relative glucose metabolism during evening wakefulness than morning wakefulness in the depressed sample only (p < .05 at the corrected cluster level), projected onto a glass brain (A) and transverse sections (B). The volumes of interest corresponding to left amygdala (C), anterior cingulate cortex (D), and posterior hypothalamus (E) are also presented. The color scale on the right depicts t values for the evening-morning contrast.