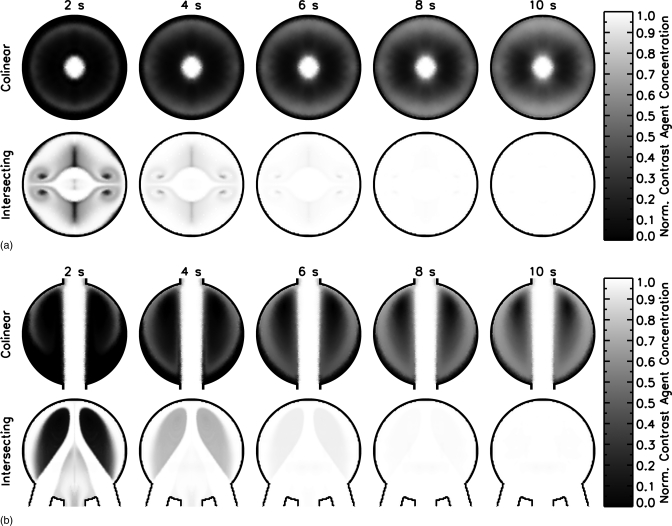
Figure 4.
Comparison of contrast agent distribution in two different mold designs as a function of time a) Plane A view b) Plane B view. The total flow rate for both mold designs was 1.0 ml/s and the mold began filled with water. At a time of 0 s, the inlet concentration of contrast agent solution instantaneously increased to 100%. The contrast solution distributes more evenly in the intersecting design than in the colinear design.

