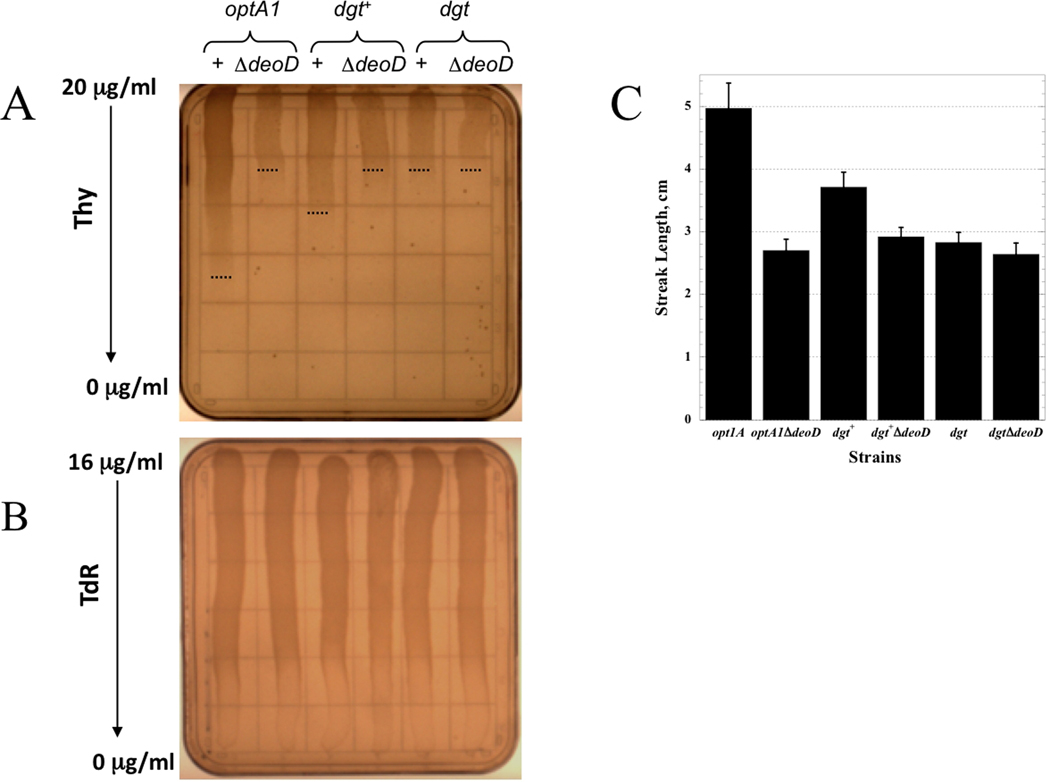
Fig. 2.
Thymine requirements of thyA and thyA deoD strains with different dgt expression levels as determined on thymine gradient plates. Suspensions of the indicated cultures were streaked on minimal-medium plates containing a gradient from top to bottom of decreasing thymine or thymidine concentrations. A. Thymine gradient from 20 to 0 µg/ml. B. Thymidine gradient from 16 to 0 mg/ml. The thymidine gradient plate also contained CAA. C. Histogram of observed growth (streak lengths) of the corresponding strains on thymine gradient plates. A total of ten plates was used for standard error calculation.

