Figure 1.

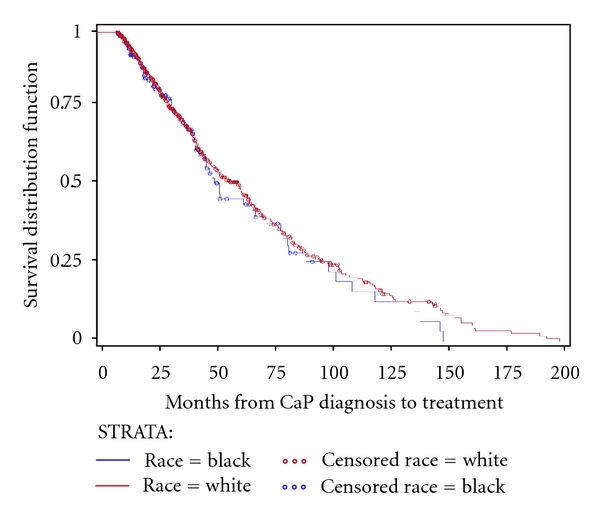
Kaplan Meier unadjusted estimation curve for time to secondary treatment stratified by race among subjects with prostate cancer (CaP) followed on active surveillance (AS) for primary treatment (N = 886).

Kaplan Meier unadjusted estimation curve for time to secondary treatment stratified by race among subjects with prostate cancer (CaP) followed on active surveillance (AS) for primary treatment (N = 886).