Figure 2.

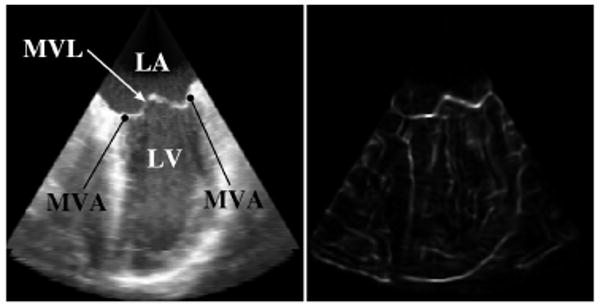
Corresponding views of a slice through a 3DUS volume showing the original intensity (left) and the TTD (right). (LA: Left Atrium; LV: Left Ventricle; MVL: Mitral Valve Leaflets; MVA: Mitral Valve Annulus)

Corresponding views of a slice through a 3DUS volume showing the original intensity (left) and the TTD (right). (LA: Left Atrium; LV: Left Ventricle; MVL: Mitral Valve Leaflets; MVA: Mitral Valve Annulus)