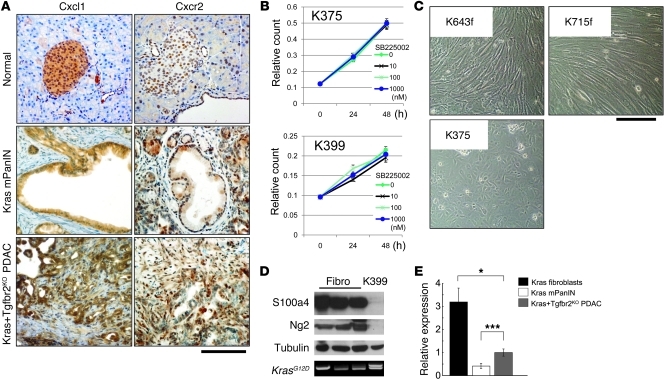
Figure 4. The Cxcl1-Cxcr2 axis might be important in the tumor-stromal interaction in the PDAC tumor microenvironment.
(A) Immunohistochemistry of Cxcl1 and Cxcr2 in Kras+Tgfbr2KO PDAC, Kras mPanIN, and normal pancreas tissue. PDAC tissue showed more abundant expression of Cxcl1 and Cxcr2. Cxcl1 was expressed mainly in the epithelial cells. Cxcr2 was also positive in the epithelial cells, and the staining was relatively prominent at the invasive front of PDAC, both in the epithelium and stroma. Scale bar: 125 μm. (B) Cxcr2 inhibition did not change proliferation of the Kras+Tgfbr2KO PDAC cells. Cell proliferation assay of the Kras+Tgfbr2KO PDAC cells (K375, K399) with 0–1 μM SB225002, a CXCR2 inhibitor, demonstrated no inhibition with any concentration of SB225002. (C) Representative photomicrographs of Ptf1acre/+;LSL-KrasG12D/+ fibroblasts (K643f, K715f) and Kras+Tgfbr2KO PDAC cells (K375). Scale bar: 125 μm. (D) Western blotting showed that Ptf1acre/+;LSL-KrasG12D/+ fibroblasts (fibro) expressed fibroblast antigens (S100a4, Ng2), while the Kras+Tgfbr2KO PDAC cells (K399) did not. Tubulin was used as a loading control. Genomic DNA PCR showed Kras allele recombination (top band) in Kras+Tgfbr2KO PDAC cells but not in Ptf1acre/+;LSL-KrasG12D/+ fibroblasts. (E) QRT-PCR showed much higher Cxcr2 mRNA expression in fibroblasts compared with epithelial cells in the pancreas. Data from Cxcr2 expression in Kras+Tgfbr2KO PDAC cells were set as 1, and relative quantity is shown. *P < 0.05; ***P < 0.001.

