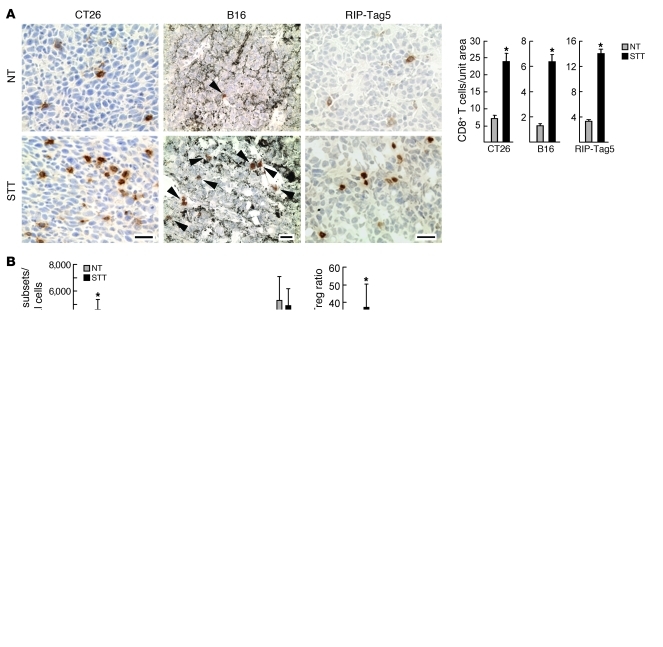
Figure 1. Homeostatic and thermally inducible trafficking of CD8+ T cells at organ sites in NT control and STT-treated mice.
(A) Photomicrographs of immunostained endogenous CD8+ T cells (arrowheads denote CD8+ T cells in melanin+ B16 tumors), and quantification of CD8+ T cell infiltration. (B) Infiltration of leukocyte subsets in B16-OVA tumors; CD8+ T cells (CD8+CD3+), CD4+ T cells (CD4+CD3+), Tregs (CD4+CD25+FoxP3+), granulocytic MDSCs (CD11b+Ly6G+Ly6Clo), monocytic MDSCs (CD11b+Ly6ChiLy6G–); polymorphonuclear cells (PMNs; CD11b+ Ly6G+ Ly6C–), and macrophages (MΦ, CD11b+Ly6C–Ly6G–). Data are pooled tumors (3 per group) from 5 independent experiments. (C and D) Short-term (1 hour) homing of TK1 cells (C) or activated OT-I T cells (D) to mesenteric LNs (MLNs), Peyer patches (PP), tumor, pancreas (Panc), and kidney. (C) Representative photomicrographs and quantification of TRITC-labeled TK1 CD8+ T cells (red) in tissues counterstained for CD31+ vessels (green). (D) Quantification of TRITC-labeled OT-I T cells in B16-OVA tumor–bearing mice by microscopy. Representative dot plots show the phenotype of TRITC-labeled OT-I T cells that trafficked into LNs and tumors. CD62L is L-selectin. Data are based on analysis of equivalent numbers of transferred CD8+ T cells in pooled samples (n = 3 mice); numbers denote percent positive cells. (A, C, and D) Data are representative of at least 3 independent experiments. *P < 0.01, #P < 0.05, NT versus STT. Scale bars: 100 μm.

