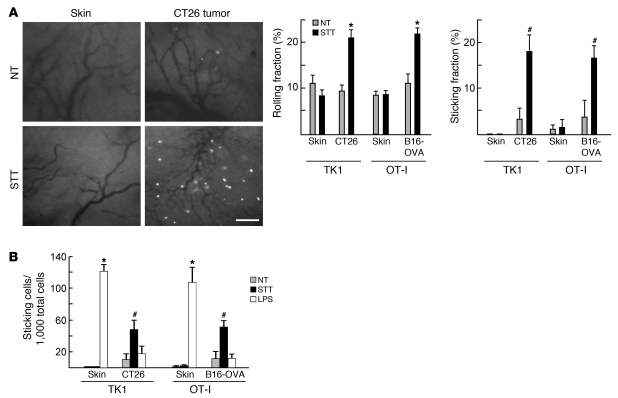
Figure 2. T cell–EC interactions in normal skin vessels and tumor vessels.
(A) Representative images showing interactions between calcein-labeled TK1 CD8+ T cells and vessels. Rolling and sticking fractions of TK1 T cells and effector OT-I T cells in vessels are also shown. Scale bar: 100 μm. (B) Frequency of arrested T cells per 1,000 total cells. Data are from more than 3 independent experiments. *P < 0.001, #P < 0.04 versus NT. There was no statistical difference between NT and LPS treatment groups in the tumor (CT26, P < 0.08; B16-OVA, P < 0.4).

