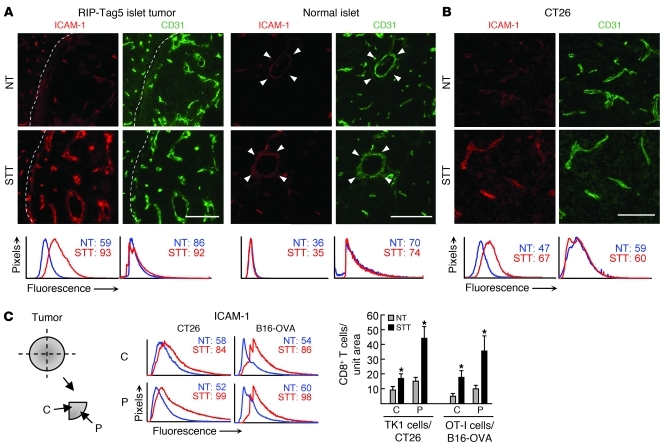
Figure 4. Thermal induction of ICAM-1 in tumor vessels.
Intravascular staining of ICAM-1 in pancreata from RIP-Tag5 mice (A) and CT26 tumors (B) by intravenous injection of anti–ICAM-1 antibody. Tissue sections were stained with TRITC-conjugated secondary antibody (red) and counterstained with anti-CD31 antibody (green) to visualize vascular structures. Dotted lines indicate tumor boundary; arrowheads indicate normal pancreatic islets of RIP-Tag5 mice. Scale bars: 100 μm. (C) Expression of vascular ICAM-1 and CD8+ T cells trafficking in the center (C) and periphery (P) of CT26 and B16-OVA tumors. Histograms depict quantification of immunofluorescence intensity of ICAM-1 or CD31 in all CD31+ vessels; numbers denote MFI. Bar graphs depict CD8+ T cell infiltration. All data are representative of at least 3 independent experiments. *P < 0.05 versus NT.

