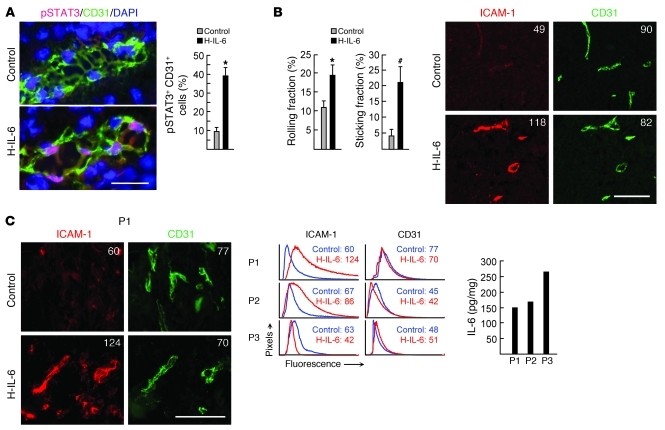
Figure 6. Vascular response to H-IL-6 in murine and patient tumors.
(A) Immunofluorescence staining of pSTAT3 (red) in CD31+ (green) B16-OVA tumor vessels 15 minutes after intravenous administration of H-IL-6 fusion protein. Nuclei were stained with DAPI (blue). Microscopic quantification of pSTAT3 staining in CD31+ ECs is also shown; data are representative of 3 independent experiments. Scale bar: 50 μm. *P < 0.001 versus control. (B) OT-I interactions with B16-OVA tumor vessels 6 hours after H-IL-6 treatment; data are from 3 independent experiments. Intravascular staining of ICAM-1 (red) on CD31+ (green) B16-OVA tumor vessels 6 hours after H-IL-6 treatment is also shown. Scale bar: 100 μm. *P < 0.001, #P < 0.03 versus control. (C) Representative photomicrographs of immunofluorescence staining of ICAM-1 on CD31+ vessels in tumor explants of patient 1 (P1) after treatment with H-IL-6 for 6 hours. ICAM-1 and CD31 expression in 3 patient tumor explants is shown by histograms representing quantitative image analysis of the immunofluorescence intensity of adhesion molecules in CD31+ vessels. Numbers in photomicrographs and histograms are MFI. IL-6 concentration in patient tumor explants is also shown. Scale bar: 100 μm.

