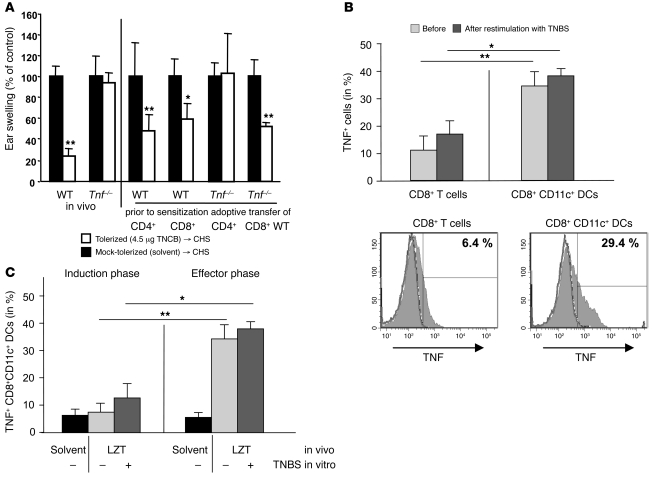
Figure 7. CD8+ DCs are the critical source for TNF in LZT.
(A) LZT assessed by measuring CHS responses after challenge in tolerized (white bars) or mock-tolerized (solvent-treated; black bars) WT mice and Tnf–/– mice that were then sensitized, and in tolerized or solvent-treated WT mice or Tnf–/– mice that were first injected with CD4+ or CD8+ lymph node cells from naive WT mice and then sensitized. 1 of 3 independent experiments with similar results is shown (5–6 mice per group and per experiment). (B) Percentage of TNF-positive CD8+ T cells and TNF-positive CD8+CD11c+ DCs obtained from tolerized, sensitized, and challenged WT mice as assessed by flow cytometry (staining for intracellular TNF) before and after restimulation with TNBS in vitro 24 hours after challenge (during the effector phase of LZT). Pooled data of 3 to 5 independent experiments with similar results (5 mice per group per experiment) (upper panel) and from 1 representative experiment (lower panels) are shown. (C) Percentage of TNF-positive CD8+CD11c+ DCs obtained before challenge (during the LZT induction phase) or after challenge (during the LZT effector phase) from tolerized mice that had been sensitized and challenged or mock-tolerized (solvent-treated) animals. Cells were analyzed by intracellular FACS staining for TNF before or after restimulation with TNBS. Pooled data of 3 to 5 independent experiments with similar results (5 mice per group per experiment) are demonstrated. Data are shown as mean ± SD. *P < 0.05; **P < 0.01.

