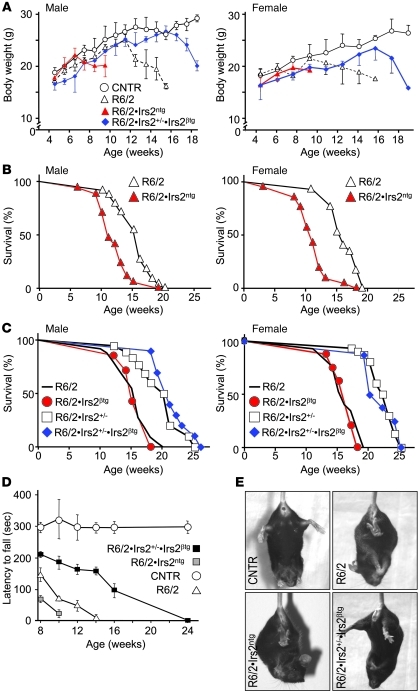
Figure 1. Effect of Irs2 signaling on life span and motor function.
(A) Average body weight of male and female control (CNTR; B6CBAF1/3J without the R6/2 transgene), R6/2, R6/2•Irs2ntg, and R6/2•Irs2+/–•Irs2βtg mice (n = 20 per group). (B) Kaplan-Meier plots showing survival probability for R6/2 and R6/2•Irs2ntg male and female mice. (C) Kaplan-Meier plots showing survival probability for R6/2, R6/2•Irs2βtg, R6/2•Irs2+/–, and R6/2•Irs2+/–•Irs2βtg male and female mice. See Supplemental Tables 1 and 2 for details on statistical analysis. (D) Motor performance was measured biweekly using an accelerating Rotarod apparatus, and latency to fall was recorded for control, R6/2, R6/2•Irs2ntg, and R6/2•Irs2+/–•Irs2βtg male mice. Average time on the rod for each study group is shown (n = 20). (E) Representative images of limb clasping of experimental mice.

