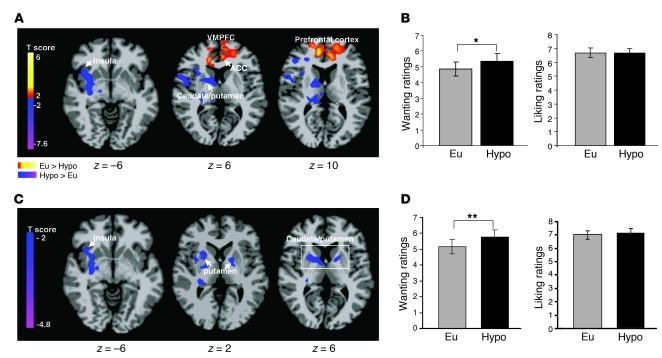
Figure 4. Condition × task effects.
(A) Axial slices with group averages (n = 14), covaried for BMI, showing brain response to food (high-calorie and low-calorie) cues under euglycemia compared with mild hypoglycemia (threshold of P < 0.05, 2-tailed, FWE whole brain corrected). (B) Wanting and liking ratings for food during euglycemia (gray bars) and mild hypoglycemia (black bars). *P = 0.02. (C) Brain response specifically to high-calorie food images under euglycemia compared with mild hypoglycemia (threshold of P < 0.05, 2-tailed, FWE whole brain corrected). (D) Wanting and liking ratings for high-calorie foods during euglycemia (gray bars) and mild hypoglycemia (black bars); **P = 0.006. Red/orange areas show greater activity, and blue areas indicate more suppressed activity during euglycemia relative to hypoglycemia. MNI coordinates were used to define brain regions.

