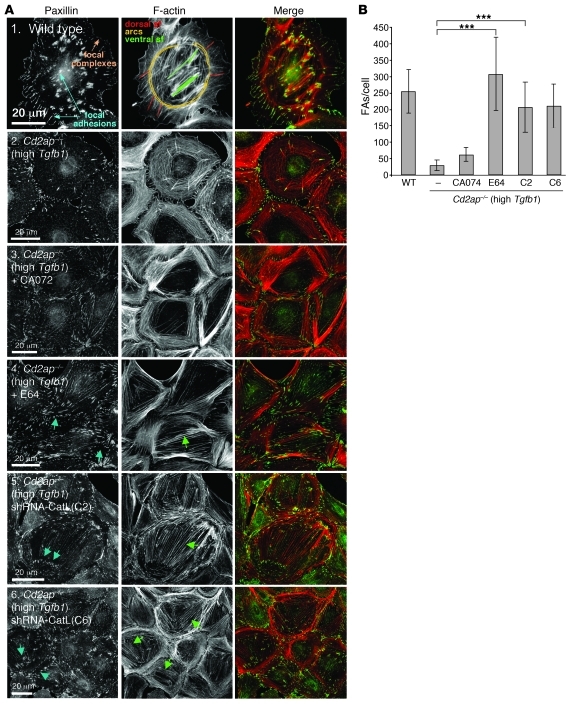
Figure 4. Number of FAs within WT podocytes and high-Tgfb1 Cd2ap–/– podocytes with CatL downregulation by diverse treatments.
(A) Organization of the actin cytoskeleton and FAs in podocytes in which CatL was downregulated. FAs and F-actin were visualized with anti-paxillin and rhodamine-phalloidin, respectively. (B) Quantitation representing measurements of >50 cells shown in A. Data are mean ± standard deviation. ***P < 0.001. Scale bars: 20 μm.

