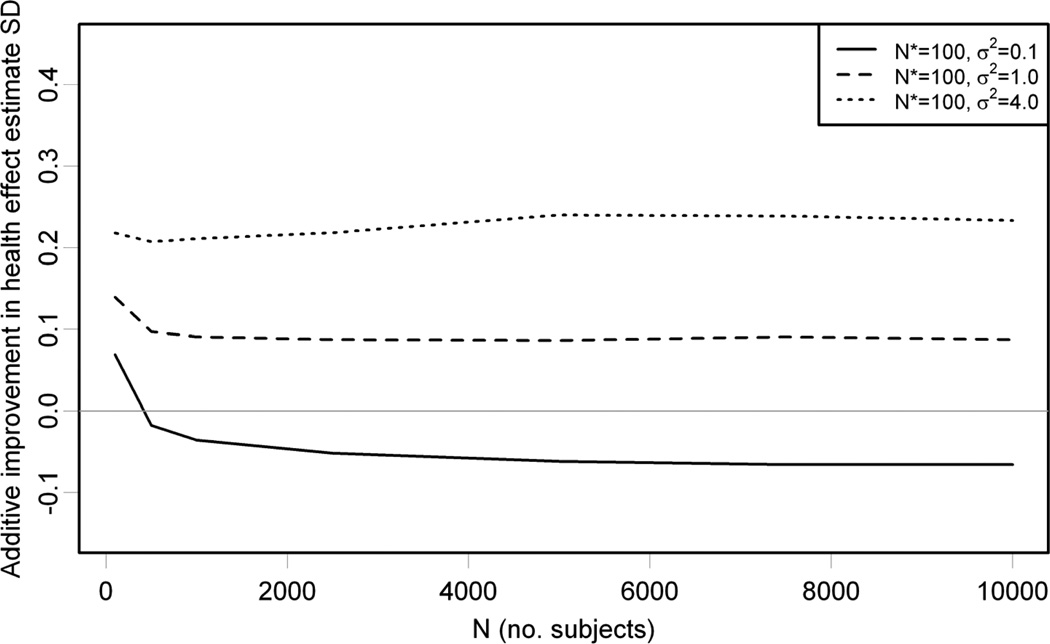
Figure 3.
Results from 5,000 Monte Carlo simulations with N* = 100, σ2 = 0.1,1.0,4.0, and N ranging from 100 to 10,000. The vertical axis shows the difference between standard deviation (SD) of β̂X from the misspecified and correct exposure models. A positive difference indicates that the correctly specified model is more efficient. For all values of σ2, the average exposure model prediction accuracies are between 0.73 and 0.75 and between 0.49 and 0.50 .

